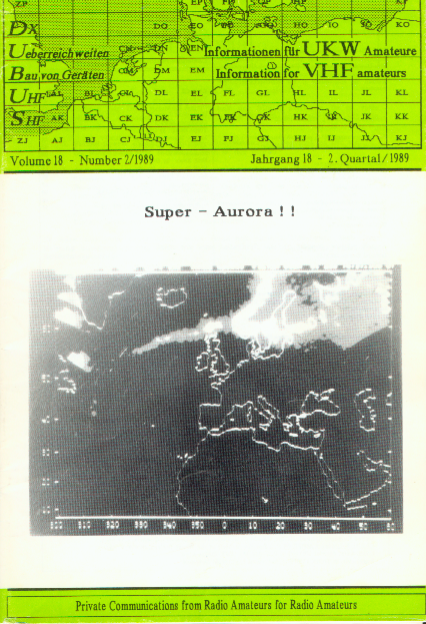
| AURORA News by DK3UZ |
G2FKZ, IARU Region I Aurora Coordinator, writes:
A complete analysis of the March 13 aurora is not possible at this stage, so
all we can report now is some of the highlights. For some months now the sun has
shown us a pattern of a quiet side then a more active side, with the quietest
period slowly moving to appear a day or so later each rotation. However, more
recently the active side peak began jumping ahead by 4or5 days, a classic case
of solar restructuring was underway, something was going to happen, and at this
stage of the cycle it was most likely to be a surge of new activity.
From March 1st solar activity began to increase in spurts, with geomagnetic
levels being very unsettled at mid latitudes, and storm levels at high
altitudes. As each new region appeared over the sun’s east limb, so the levels
of activity increased and by the 5th of Mach we had storm levels everywhere. On
the 6th March solar region 5395 located at north 34ş
heliographic longitude L=257 rotated over the east limb into view. By 1354UT
that day, a major x-ray flare began which lasted 137 minutes, it has been
‘estimated’ that it reached a level of X15/3B because the satellite x-ray
sensors became saturated at X12. It was the largest flare this cycle and is
possibly the largest this century. The region continued very active and by the
12th when it was crossing the central meridian it had produced 6X-class and 26
M-class x-ray flares. This active region has about 60 spots in a very complex
beta-gamma-delta magnetic configuration, and was 2815 millionths of the visible
disc in size. It is classified as an EKC magnetic BGD.
On the 8th March at 1735 a proton event began with particle levels increasing all the time together with a pole cap absorption event. The flares the proton events and the pole cap events continued every day, until the 13th by when 3500 (protons/cm2 -sec-sr) were arriving, and the pole cap absorption measured 6dB. Meanwhile massive 10cm and 3cm bursts of solar flux were being reported, up to 18000 units on the 6th and 12000 by the 10th with 3cm bursts up to 1200% above normal. At the lower frequencies of 245 MHz the peak flux reached 220000 units, and at 2695 MHz 18000 units.
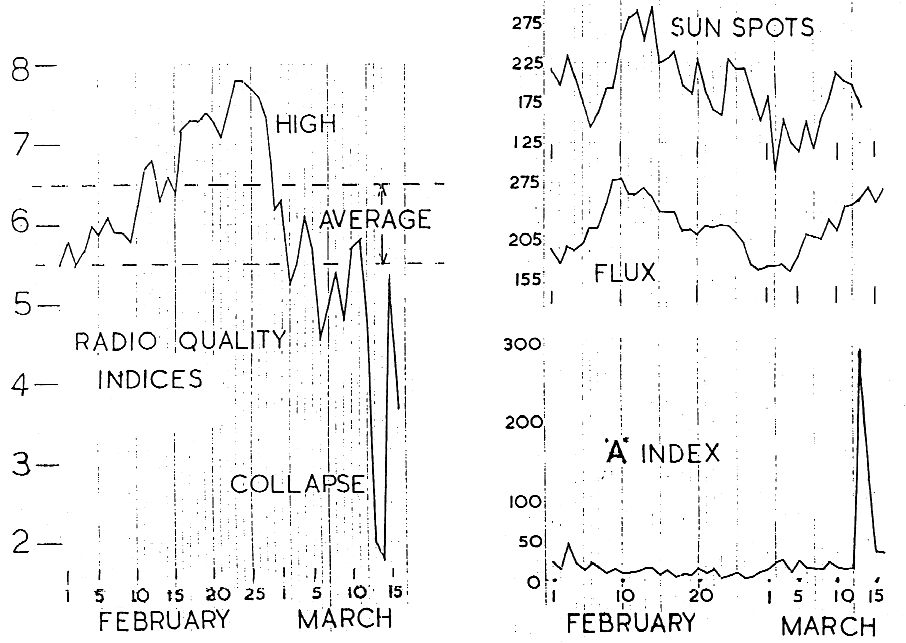
With regard to sudden ionospheric disturbances I must admit I lost count. They were reported from all over the world, not just fade outs but phase anomalies. enhancement of atmospherics, etc. The radio quality indices, (Fig 1) which compares H.F. band conditions with that of previous 27 days, and possibly the best guide of ionospheric conditions world wide from Europe showed a classic pre-storm enhancement. During the peak February 25th and 26th the 50MHz band was open to Japan with G4UPS making a first with JH4IUO and another first with VS6UP. Chinese television was also being heard. Just prior to this on the 20th G4FJK also had first to VK6KXW, and LU8MBL had 30 QSO's with European stations. By March 1st a steep decline started until the collapse by the 12th. No recovery had occurred by the 21st. Visual auroras were reported by observatories in France, Belgium, and the Netherlands. The southern hemisphere was not so seriously affected as the magnetic levels only reached an A index of 128 at Kerguelen (S49 E70) for the 13th. The India index recorded 355 units, out of the maximum possible of 400. In (Fig2) I have plotted the spot count solar flux and geomagnetic 'A' index, note the low level for the enhancement period.
I do not know for certain as the data is not yet to hand, but the flare on the 6th did not result in any radio aurora. One reason for this could be that the the interplanetary magnetic field was a north seeking field at the time, and as the earth is always a north field, there was little or no coupling. By the 13th we had crossed a sector boundary, which meant that now we had a south field. By this time the sun's disc field was level with the earth so good coupling for particle input resulted.
tu for info, Charlie
144 MHz -1, 144 MHz -2, 432 MHz